
Learn Methods of Measuring Trend in Time Series: Graphical, Semi-Average, Moving Average, and Least Square Methods with examples, formulas also FAQ and MCQ with answer.
Methods of Measuring Trend
Introduction
Trend Analysis is an important part of Time Series Analysis. It refers to the study of the long-term movement or general direction of a time series data over a period of time.
Trend may show a long-term increase, decrease, or relatively stable movement in variables such as sales, production, population, profit, prices, student enrollment, demand, etc.
For example, if the sales of a company increase continuously over several years, the series shows an Increasing Trend.
Major Methods of Measuring Trend
The following four methods are commonly used:
- Graphical Method
- Semi-Average Method
- Moving Average Method
- Least Square Method
Graphical Method
Meaning
The Graphical Method is the simplest method of measuring trend. In this method, time is represented on the X-axis, while the corresponding values of the time series are represented on the Y-axis.
The observations are plotted on a graph and joined by straight lines. The general direction of the plotted line indicates the trend.
Example
Suppose the annual sales of a company are:
| Year | Sales (₹ Lakh) |
| 2021 | 100 |
| 2022 | 110 |
| 2023 | 125 |
| 2024 | 135 |
| 2025 | 150 |
The years are plotted on the X-axis and sales on the Y-axis.
Trend of Annual Sales
Annual sales increase from ₹100 lakh in 2021 to ₹150 lakh in 2025.
# Python Code
import matplotlib.pyplot as plt
# Data
years = [2021, 2022, 2023, 2024, 2025]
sales = [100, 110, 125, 135, 150]
# Create Line Graph
plt.figure(figsize=(8, 5))
plt.plot(years, sales, marker=’o’, linewidth=2)
# Title and labels
plt.title(“Graphical Method – Trend of Sales”)
plt.xlabel(“Year”)
plt.ylabel(“Sales (₹ Lakhs)”)
# Show values on each point
for x, y in zip(years, sales):
plt.text(x, y + 2, str(y), ha=’center’)
# Grid
plt.grid(True)
# Display graph
plt.show()
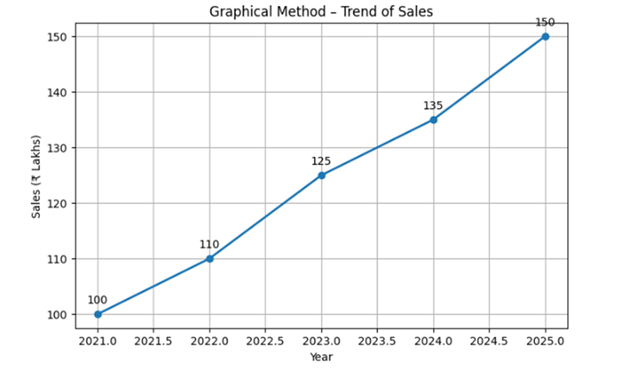
The upward movement indicates an increasing trend.
Interpretation
The graph moves upward from left to right. Therefore, the company has an Increasing Trend in sales.
Procedure
- Take time periods on the X-axis.
- Take the corresponding values on the Y-axis.
- Select an appropriate scale.
- Plot each observation on the graph.
- Join the plotted points.
- Observe the general direction of the line.
- Determine whether the trend is increasing, decreasing, or stable.
Advantages
- Very simple and easy to understand.
- Requires minimum mathematical calculation.
- Provides a visual representation of the trend.
- Useful for presenting data to non-technical users.
- The general direction of a large data set can be identified quickly.
Limitations
- It is relatively subjective.
- It does not provide an exact mathematical trend equation.
- Different persons may draw slightly different trend lines.
- It has limited usefulness for precise forecasting.
- Exact comparison between different time series may be difficult.
Semi-Average Method
Meaning
The Semi-Average Method is a simple mathematical method of measuring trend.
In this method, the time series is divided into two equal parts. The arithmetic mean of each part is calculated. These two averages are called Semi-Averages.
The two semi-average points are then plotted on a graph and joined to obtain the trend line.
Example
Consider the following sales data:
| Year | Sales |
| 2021 | 20 |
| 2022 | 24 |
| 2023 | 28 |
| 2024 | 32 |
| 2025 | 36 |
| 2026 | 40 |
There are 6 years, so the data can be divided into two equal groups.
First Half
2021, 2022, 2023
Semi-Average1= (20+24+28)/3 =72/3=24
Therefore:
First Semi-Average = 24
Second Half
2024, 2025, 2026
Semi-Average2= (32+36+40)/3 =108/3=36
Therefore:
Second Semi-Average = 36
The two points representing the semi-averages are plotted on a graph and joined to obtain the trend line.
Semi-Average Table
| Period | Years | Average |
| First Half | 2021–2023 | 24 |
| Second Half | 2024–2026 | 36 |
Odd Number of Years
Suppose there are 5 years:
2021, 2022, 2023, 2024, 2025
In such a case, the middle year is generally excluded and the remaining observations are divided into two equal groups.
First group: 2021, 2022
Middle year: 2023
Second group: 2024, 2025
Advantages
- Simple and easy to calculate.
- Requires less mathematical work.
- Easy to understand and interpret.
- Useful for identifying the general direction of trend.
Limitations
- Not all observations may be used when the number of years is odd.
- The middle observation may be ignored.
- It does not provide a highly accurate trend equation.
- Less suitable for detailed forecasting than the Least Square Method.
Moving Average Method
Meaning
The Moving Average Method is a method of measuring trend in which the average of a fixed number of consecutive observations is calculated.
After calculating the first average, the period is moved forward by one observation and another average is calculated.
This process continues throughout the series.
The main purpose of the Moving Average Method is to smooth short-term fluctuations and make the underlying trend more visible.
Example: 3-Year Moving Average
Consider the following data:
| Year | Sales |
| 2021 | 10 |
| 2022 | 12 |
| 2023 | 15 |
| 2024 | 18 |
| 2025 | 20 |
First 3-Year Moving Average
(10+12+15)/3=37/3=12.33
This average is assigned to the middle year, 2022.
Second 3-Year Moving Average
(12+15+18)/3=45/3=15
This average is assigned to 2023.
Third 3-Year Moving Average
(15+18+20)/3=53/3=17.67
This average is assigned to 2024.
Final Table
| Year | Actual Value | 3-Year Moving Average |
| 2021 | 10 | — |
| 2022 | 12 | 12.33 |
| 2023 | 15 | 15.00 |
| 2024 | 18 | 17.67 |
| 2025 | 20 | — |
Interpretation
The Moving Average values increase from 12.33 → 15.00 → 17.67, indicating an increasing trend.
Types of Moving Average
3-Year Moving Average
The average of three consecutive observations is calculated.
4-Year Moving Average
The average of four consecutive observations is calculated.
5-Year Moving Average
The average of five consecutive observations is calculated.
Even-Number Moving Average
When an even number such as 4-year or 6-year Moving Average is used, the calculated averages may fall between two time periods. Therefore, centering of moving averages is generally required to obtain trend values corresponding to actual time periods.
Advantages
- Reduces short-term fluctuations.
- Makes the underlying trend clearer.
- Easy to understand and apply.
- Useful for smoothing time series data.
- Less affected by individual extreme observations.
Limitations
- Trend values are not available for some observations at the beginning and end of the series.
- Selection of the moving-average period is important.
- It does not normally provide a mathematical trend equation.
- Forecasting beyond the available data is limited.
- Each observation receives equal weight.
Least Square Method
Meaning
The Least Square Method is one of the most scientific and mathematical methods of measuring trend.
It determines a trend line in such a way that the sum of the squared deviations between actual values and trend values is minimized.
The general linear trend equation is:
Y=a+bX
Where:
Y = Trend value
a = Intercept or constant
b = Slope or rate of change
X = Time variable
When the time values are coded in such a way that:
∑X=0
then:
a=∑Y / N
and
b=∑XY / X2
Therefore:
Yc=a+bX
where Yc represents the calculated trend value.
Example
Suppose the annual sales are:
| Year | Y |
| 2021 | 20 |
| 2022 | 24 |
| 2023 | 28 |
| 2024 | 32 |
| 2025 | 36 |
Since there are five years, the middle year, 2023, is assigned X=0.
| Year | Y | X | XY | X² |
| 2021 | 20 | -2 | -40 | 4 |
| 2022 | 24 | -1 | -24 | 1 |
| 2023 | 28 | 0 | 0 | 0 |
| 2024 | 32 | 1 | 32 | 1 |
| 2025 | 36 | 2 | 72 | 4 |
| Total | 140 | 0 | 40 | 10 |
Step 1: Calculate a
a= ∑Y / N
a=140 / 5 = 28
Therefore:
a=28
Step 2: Calculate b
b= ∑XY / ∑X2
b=40 / 10 =4
Therefore:
b=4
Step 3: Trend Equation
Yc=a+bX
Therefore:
Yc=28+4X
Calculation of Trend Values
For 2021
X=−2
Yc=28+4(−2)
Yc=20
For 2022
X=−1
Yc=28+4(−1)
Yc=24
For 2023
X=0
Yc=28
For 2024
X=1
Yc=32
For 2025
X=2
Yc=36
Thus, the trend values are:
| Year | Actual Value | Trend Value |
| 2021 | 20 | 20 |
| 2022 | 24 | 24 |
| 2023 | 28 | 28 |
| 2024 | 32 | 32 |
| 2025 | 36 | 36 |
The value of b = 4 indicates that the variable is increasing by 4 units per year according to this fitted linear trend.
Advantages
- It is a scientific and mathematical method.
- All observations are considered.
- It provides a trend equation.
- It can be used for forecasting.
- It is more objective than the graphical method.
- It provides a quantitative measure of the trend.
Limitations
- Calculations are comparatively complex.
- Proper coding of time values is required.
- A linear trend may not be appropriate for every data set.
- Sudden structural changes may not be adequately represented.
- Forecasts based on the equation may be unreliable if the historical pattern changes significantly.
Comparison of the Four Methods
| Method | Basis | Mathematical Complexity | Forecasting | General Accuracy |
| Graphical Method | Graph | Low | Limited | Low |
| Semi-Average Method | Arithmetic averages of two parts | Low | Limited | Moderate |
| Moving Average Method | Averages of consecutive observations | Moderate | Limited | Good for smoothing |
| Least Square Method | Mathematical equation | High | Good | Generally high for a suitable model |
Important Examination Points
Graphical Method → Trend is identified using a graph.
Semi-Average Method → Data is divided into two parts and their averages are calculated.
Moving Average Method → Consecutive observations are averaged to smooth fluctuations.
Least Square Method → A mathematical trend equation is fitted.
General Least Square equation:
Y=a+bX
When ∑X=0:
a=∑Y / N
And:
b= ∑XY / ∑X2
Moving Average is mainly used for smoothing fluctuations.
Graphical Method is the simplest method.
Least Square Method is a scientific and objective method.
Least Square Method is particularly useful when a trend equation and forecasting are required.
FAQ – Frequently Asked Questions
Q1. What is Trend in Time Series?
Answer: Trend is the long-term general direction of movement in a time series. It may be increasing, decreasing, or relatively stable.
Q2. What are the main methods of measuring Trend?
Answer: The four major methods are:
Graphical Method
Semi-Average Method
Moving Average Method
Least Square Method
Q3. Which is the simplest method of measuring Trend?
Answer: The Graphical Method is the simplest method.
Q4. What is the purpose of the Semi-Average Method?
Answer: It divides the time series into two parts and uses the averages of these two parts to determine the general trend.
Q5. What is a Moving Average?
Answer: A Moving Average is the average of a fixed number of consecutive observations that moves through the time series one period at a time.
Q6. What is a 3-Year Moving Average?
Answer: It is the average calculated from three consecutive yearly observations.
Q7. Why is the Moving Average Method used?
Answer: It is mainly used to smooth short-term fluctuations and reveal the underlying trend.
Q8. What is the general equation of a linear trend?
Answer:
Y=a+bX
Q9. What does b represent in the Least Square equation?
Answer: b represents the slope or rate of change of the trend per unit of time.
Q10. What is the condition used to simplify the Least Square calculations?
Answer:
∑X=0
Q11. Which method is useful for forecasting?
Answer: The Least Square Method is particularly useful because it provides a mathematical trend equation.
Q12. What happens when an odd number of years is used in the Semi-Average Method?
Answer: The middle observation is generally excluded, and the remaining observations are divided into two equal groups.
Q13. What is centering in Moving Average?
Answer: Centering is the process of adjusting an even-numbered moving average so that the average corresponds to an actual time period.
Q14. Which method uses all observations and provides a mathematical equation?
Answer: Least Square Method.
Q15. Which method is mainly visual?
Answer: Graphical Method.
MCQs – Multiple Choice Questions
What does Trend represent in a Time Series?
A) Short-term fluctuation
B) Long-term general movement
C) Random error only
D) Seasonal variation only
Answer: B) Long-term general movement
Which is the simplest method of measuring Trend?
A) Least Square Method
B) Moving Average Method
C) Graphical Method
D) Semi-Average Method
Answer: C) Graphical Method
In the Graphical Method, time is generally represented on:
A) Y-axis
B) X-axis
C) Z-axis
D) None of these
Answer: B) X-axis
In the Graphical Method, the values of the variable are generally represented on:
A) X-axis
B) Y-axis
C) Both axes
D) None
Answer: B) Y-axis
In the Semi-Average Method, the data is divided into:
A) Two parts
B) Three parts
C) Four parts
D) Five parts
Answer: A) Two parts
What is calculated for each part in the Semi-Average Method?
A) Median
B) Mode
C) Arithmetic Mean
D) Range
Answer: C) Arithmetic Mean
A 3-Year Moving Average uses:
A) 2 observations
B) 3 observations
C) 4 observations
D) 5 observations
Answer: B) 3 observations
The main purpose of the Moving Average Method is to:
A) Increase fluctuations
B) Remove all observations
C) Smooth short-term fluctuations
D) Increase the sample size
Answer: C) Smooth short-term fluctuations
Which method is particularly useful for smoothing a Time Series?
A) Graphical Method
B) Moving Average Method
C) Semi-Average Method
D) Sampling Method
Answer: B) Moving Average Method
Which of the following is the general equation of a linear trend?
A) Y=a−bX
B) Y=a+bX
C) X=a+bY
D) Y=abX
Answer: B) Y=a+bX
In the Least Square Method, a represents:
A) Slope
B) Intercept
C) Time
D) Error
Answer: B) Intercept
In the Least Square Method, b represents:
A) Mean
B) Median
C) Slope or rate of change
D) Total value
Answer: C) Slope or rate of change
When ∑X=0, the value of a is:
A) ∑X / N
B) ∑XY / N
C) ∑Y / N
D) ∑X2 / N
Answer: C) ∑Y / N
When ∑X=0, the value of b is:
A) ∑Y / N
B) ∑XY / ∑X2
C) ∑X / ∑Y
D) ∑X2 /∑XY
Answer: B) ∑XY / ∑X2
Which method provides a mathematical Trend Equation?
A) Graphical Method
B) Semi-Average Method
C) Moving Average Method
D) Least Square Method
Answer: D) Least Square Method
Which method is most suitable when precise mathematical forecasting is required?
A) Graphical Method
B) Least Square Method
C) Semi-Average Method
D) Pie Chart Method
Answer: B) Least Square Method
If sales increase from ₹100 lakh to ₹150 lakh over five years, the graph will generally show:
A) Decreasing Trend
B) Increasing Trend
C) Constant Trend
D) No Trend
Answer: B) Increasing Trend
In an odd-numbered series, the Semi-Average Method generally excludes:
A) First observation
B) Last observation
C) Middle observation
D) All observations
Answer: C) Middle observation
What is generally required for an even-numbered Moving Average?
A) Ranking
B) Centering
C) Sampling
D) Coding only
Answer: B) Centering
Which method is relatively subjective?
A) Least Square Method
B) Graphical Method
C) Moving Average Method
D) Semi-Average Method
Answer: B) Graphical Method
Which method gives equal weight to observations within the selected moving-average window?
A) Moving Average Method
B) Least Square Method
C) Graphical Method
D) Semi-Average Method
Answer: A) Moving Average Method
If b=5 in the equation Y=100+5X, what does 5 represent?
A) Intercept
B) Mean
C) Rate of change per unit of time
D) Total value
Answer: C) Rate of change per unit of time
If the Trend Equation is Y=50+3X, what is the trend value when X=2?
A) 52
B) 53
C) 56
D) 60
Answer: C) 56
Calculation:
Y=50+3(2)=56
Which method does not normally produce a mathematical trend equation?
A) Least Square Method
B) Graphical Method
C) Both A and B
D) None
Answer: B) Graphical Method
The main objective of Trend Analysis is to:
A) Identify long-term movement
B) Delete observations
C) Increase the number of variables
D) Convert qualitative data into text
Answer: A) Identify long-term movement
Quick Revision
| Method | Key Idea |
| Graphical Method | Plot the data and observe the direction |
| Semi-Average Method | Divide data into two parts and calculate averages |
| Moving Average Method | Calculate successive averages to smooth fluctuations |
| Least Square Method | Fit a mathematical trend equation |
Some More:
- POP- Introduction to Programming Using ‘C’
- DS – Data structure Using C
- OOP – Object Oriented Programming
- Java Programming
- DBMS – Database Management System
- RDBMS – Relational Database Management System
- https://defineinfoloop.blogspot.com/?m=1