
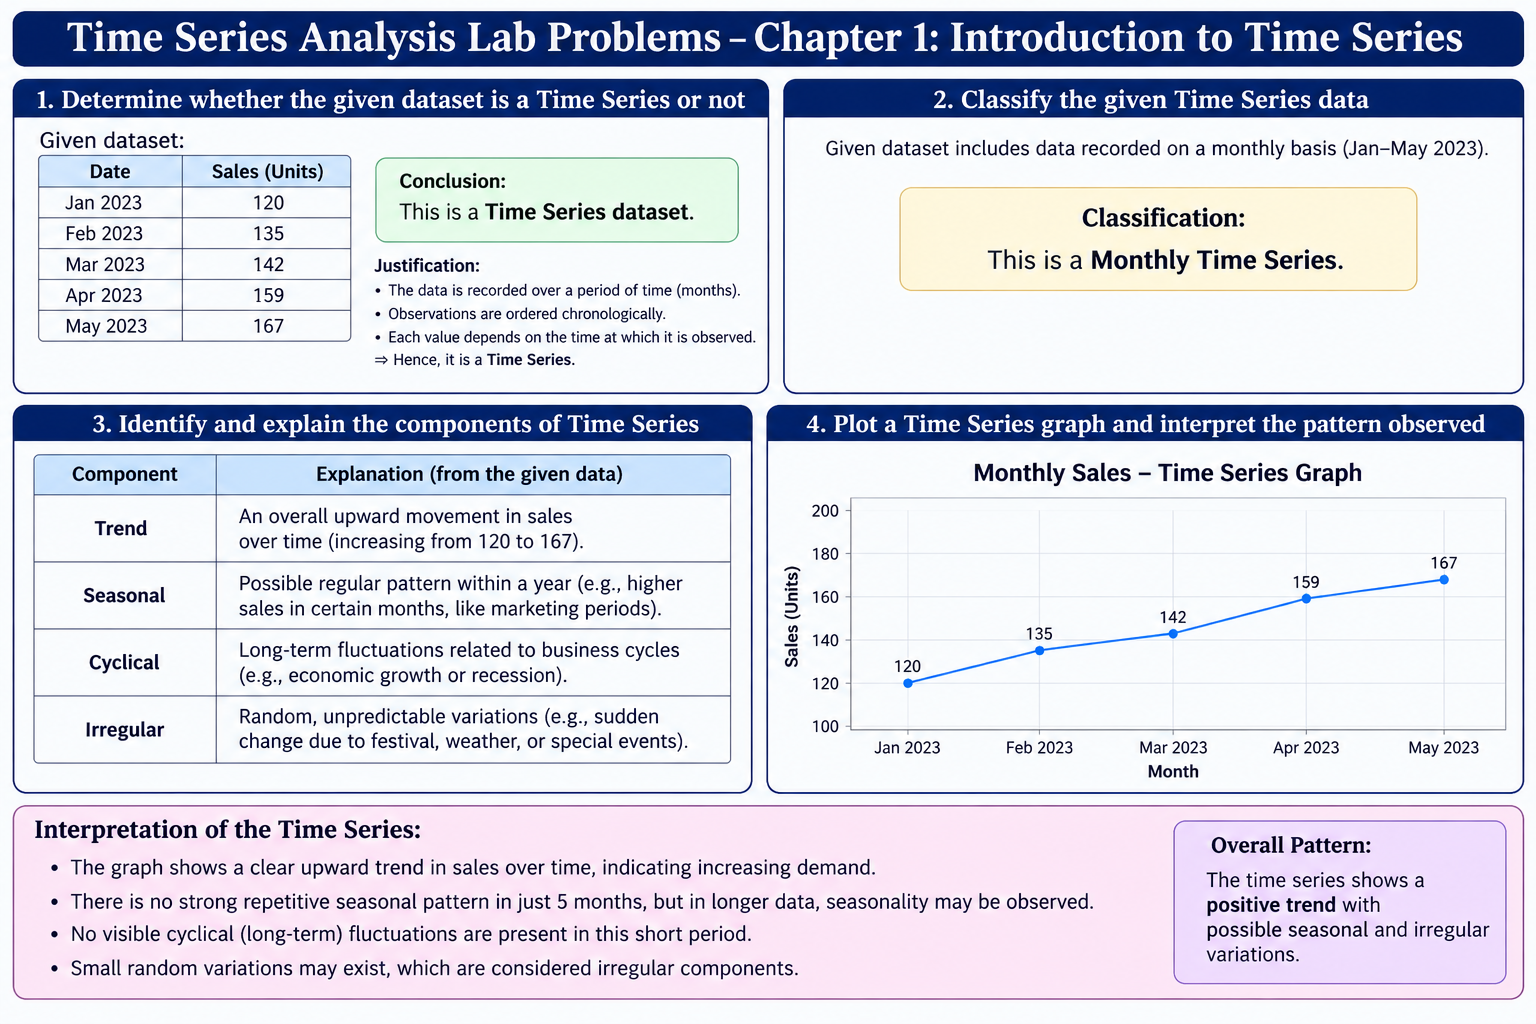
Learn Time Series Analysis through lab problems, solved examples, Python programs, graphs, viva questions, and practical exercises for Chapter 1.
Time Series Analysis Lab Problems
Chapter 1: Introduction to Time Series
- Given a dataset, determine whether it is a Time Series or not and justify your answer.
- Classify the given Time Series data into Annual, Quarterly, Monthly, or Daily Time Series.
- Identify and explain the components of Time Series (Trend, Seasonal, Cyclical, and Irregular) from the given data.
- Plot a Time Series graph and interpret the pattern observed.
Example 1: Basic Time Series Analysis Using Sales Data
Lab Problem 1: Determine Whether the Given Dataset is a Time Series
Dataset A
| Month | Sales (Units) |
| Jan | 120 |
| Feb | 135 |
| Mar | 142 |
| Apr | 150 |
| May | 165 |
| Jun | 172 |
Question
Is the above dataset a Time Series? Justify your answer.
Answer
Yes, it is a Time Series because:
- Data is collected over time.
- Observations are arranged in chronological order.
- Equal time interval (monthly) is maintained.
- The objective is to analyze changes over time.
Lab Problem 2: Classify the Time Series
Datasets
| Dataset | Data Collected |
| A | Company profit from 2019–2025 |
| B | Student admissions every quarter |
| C | Monthly rainfall from January to December |
| D | Daily temperature of a city |
Answer
| Dataset | Classification |
| A | Annual Time Series |
| B | Quarterly Time Series |
| C | Monthly Time Series |
| D | Daily Time Series |
Lab Problem 3: Identify the Components of Time Series
Dataset
| Month | Ice Cream Sales |
| Jan | 150 |
| Feb | 300 |
| Mar | 380 |
| Apr | 450 |
| May | 520 |
| Jun | 350 |
| Jul | 340 |
| Aug | 330 |
| Sep | 280 |
| Oct | 220 |
| Nov | 180 |
| Dec | 170 |
Question
Identify the components of Time Series.
Answer
| Component | Explanation |
| Trend (T) | Overall increase in sales during summer months. |
| Seasonal Variation (S) | Sales rise every summer and fall in winter. |
| Cyclical Variation (C) | Not visible because only one year’s data is available. |
| Irregular Variation (I) | Unexpected changes due to weather or special events. |
Lab Problem 4: Plot and Interpret a Time Series Graph
Dataset
| Month | Sales |
| Jan | 100 |
| Feb | 110 |
| Mar | 120 |
| Apr | 130 |
| May | 150 |
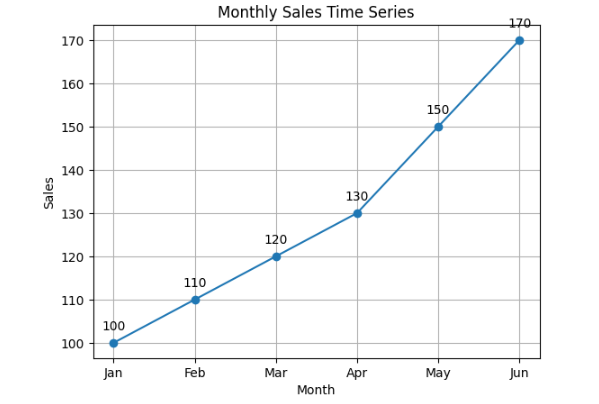
| Jun | 170 |
Question
Plot a Time Series graph and interpret the observed pattern.
Line Chart
Using Python Programming:
import matplotlib.pyplot as plt
# Dataset
months = [‘Jan’, ‘Feb’, ‘Mar’, ‘Apr’, ‘May’, ‘Jun’]
sales = [100, 110, 120, 130, 150, 170]
# Create line chart
plt.plot(months, sales, marker=’o’)
# Display sales values on each point
for i in range(len(months)):
plt.text(months[i], sales[i] + 3, str(sales[i]),
ha=’center’, fontsize=10)
# Title and labels
plt.title(‘Monthly Sales Time Series’)
plt.xlabel(‘Month’)
plt.ylabel(‘Sales’)
# Grid
plt.grid(True)
# Show chart
plt.show()
Time Series graph:
Interpretation
- Sales show a steady upward trend from January to June.
- No seasonal or cyclical pattern is visible because the dataset covers only six months.
- There are no sudden fluctuations, indicating minimal irregular variation.
- The graph suggests continuous business growth over the observed period.
Example 2: Real-World Time Series Analysis Using Business Data
Lab Problem 1: Determine Whether the Given Dataset is a Time Series
Dataset
A supermarket records its daily customer visits for one week.
| Date | Number of Customers |
| 01-Jan | 320 |
| 02-Jan | 345 |
| 03-Jan | 338 |
| 04-Jan | 360 |
| 05-Jan | 390 |
| 06-Jan | 420 |
| 07-Jan | 405 |
Question
Is the above dataset a Time Series? Justify your answer.
Solution
Yes, this is a Time Series dataset.
Justification
- The observations are collected over time.
- Data is recorded at regular daily intervals.
- The observations are arranged in chronological order.
- The dataset can be analyzed to identify patterns and forecast future customer visits.
Conclusion:
The dataset satisfies all the characteristics of a Time Series.
Lab Problem 2: Classify the Given Time Series Data
Datasets
| Dataset | Description |
| A | Annual wheat production from 2020–2025 |
| B | Bank profit reported every three months |
| C | Monthly electricity bill of a household |
| D | Daily COVID-19 cases in a city |
Question
Classify each dataset.
Solution
| Dataset | Time Series Type | Reason |
| A | Annual | Recorded once every year |
| B | Quarterly | Recorded every three months |
| C | Monthly | Recorded once every month |
| D | Daily | Recorded every day |
Lab Problem 3: Identify the Components of Time Series
Dataset
A clothing store records its monthly sales (in ₹ Thousand).
| Month | Sales |
| Jan | 220 |
| Feb | 230 |
| Mar | 240 |
| Apr | 260 |
| May | 290 |
| Jun | 340 |
| Jul | 360 |
| Aug | 355 |
| Sep | 320 |
| Oct | 300 |
| Nov | 410 |
| Dec | 520 |
Question
Identify the Time Series components from the above data.
Solution
- Trend (T)
Sales generally increase from ₹220 thousand in January to ₹520 thousand in December.
Interpretation: There is an upward trend.
- Seasonal Variation (S)
Sales increase significantly in November and December because of festivals and holiday shopping.
Interpretation: This is Seasonal Variation.
- Cyclical Variation (C)
The data covers only one year.
Therefore, cyclical variation cannot be identified because business cycles require several years of data.
- Irregular Variation (I)
Suppose sales suddenly decreased in August because of heavy rainfall or transportation issues.
This unexpected fluctuation is called Irregular Variation.
Summary
| Component | Observation |
| Trend | Upward increase in sales |
| Seasonal | High sales during festival months |
| Cyclical | Cannot be observed from one-year data |
| Irregular | Sudden unexpected fluctuations |
Lab Problem 4: Plot a Time Series Graph and Interpret It
Dataset
A mobile shop records monthly smartphone sales.
| Month | Sales |
| Jan | 120 |
| Feb | 135 |
| Mar | 150 |
| Apr | 170 |
| May | 195 |
| Jun | 220 |
| Jul | 235 |
| Aug | 240 |
| Sep | 225 |
| Oct | 215 |
| Nov | 260 |
| Dec | 310 |
Question
Plot a Time Series graph and interpret the results.
Time Series Graph
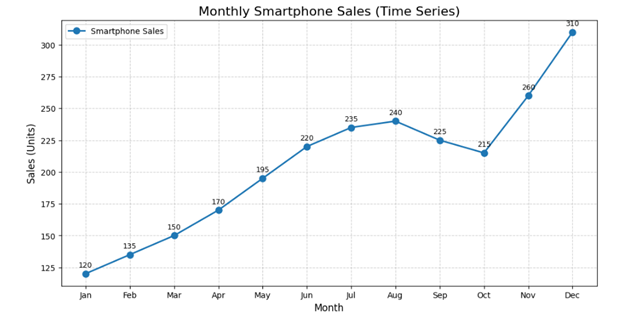
The monthly smartphone sales data indicates a strong positive trend over the year. Although sales experience a minor decline during September and October, they recover rapidly and reach the highest level in December. Overall, the graph suggests increasing market demand with possible seasonal influences during the year-end shopping period. This time series can be useful for forecasting future sales, inventory planning, and business decision-making.
Time Series Analysis – Viva Questions with Answers
- What is a Time Series?
Answer:
A Time Series is a sequence of observations or data values collected at regular intervals of time (such as daily, monthly, quarterly, or yearly). It is used to analyze patterns and forecast future values.
Example:
Monthly sales of a company from January to December.
- Why is chronological order important in Time Series data?
Chronological order is important because:
- It shows how data changes over time.
- It helps identify trends and patterns.
- It enables forecasting of future values.
- Incorrect ordering can lead to inaccurate analysis.
- How is Time Series different from Cross-Sectional Data?
| Time Series Data | Cross-Sectional Data |
| Collected over time | Collected at one point in time |
| Observations are arranged chronologically | No time order is required |
| Used to study trends and forecasting | Used to compare different individuals or groups |
| Example: Monthly rainfall | Example: Marks of students in one examination |
- Name the four components of a Time Series.
The four main components of a Time Series are:
- Trend (T)
- Seasonal Variation (S)
- Cyclical Variation (C)
- Irregular (Random) Variation (I)
-
What is a Trend?
Answer:
A Trend is the long-term movement or direction of a Time Series. It shows whether the data is generally increasing, decreasing, or remaining constant over a long period.
Example:
The annual increase in smartphone sales over the last 10 years.
- What is Seasonal Variation?
Seasonal Variation refers to regular and repetitive changes that occur within a fixed period (such as a day, month, quarter, or year) due to seasonal factors.
Example:
- Ice cream sales increase during summer.
- Woolen clothing sales increase during winter.
- What is Cyclical Variation?
Cyclical Variation refers to fluctuations that occur over several years due to economic or business cycles. These changes are not regular like seasonal variations.
Example:
Changes in automobile sales during periods of economic boom and recession.
- What is Irregular Variation?
Irregular Variation consists of unexpected and unpredictable changes caused by unusual events.
Examples:
- Floods
- Earthquakes
- Pandemics
- Wars
- Strikes
These variations cannot be predicted in advance.
- Give one example each of Annual, Quarterly, Monthly, and Daily Time Series.
| Type of Time Series | Example |
| Annual | Population of a country recorded every year |
| Quarterly | Company profit reported every quarter |
| Monthly | Monthly electricity consumption |
| Daily | Daily stock market closing prices |
- Why are graphs useful in Time Series Analysis?
Answer:
Graphs are useful because they:
- Display data visually.
- Help identify trends and seasonal patterns.
- Show increases and decreases over time.
- Make comparisons easier.
- Assist in forecasting future values.
- Simplify interpretation of large datasets.
Some More:
- POP- Introduction to Programming Using ‘C’
- DS – Data structure Using C
- OOP – Object Oriented Programming
- Java Programming
- DBMS – Database Management System
- RDBMS – Relational Database Management System
- https://defineinfoloop.blogspot.com/?m=1